Edit the assumptions directly. The model recalculates workforce mix, technically addressable task capacity, realized capacity, and the primary-care day instantly. Baseline: an illustrative 100,000-person integrated health provider.
Changes are automatically retained on this device.
Total workforce
100,000
Target denominator: 100,000
Technically addressable
31,000
FTE-equivalent tasks; not job removals
Released capacity
9,300
Gross after adoption
Augmented capacity
—
Below threshold, after fragmentation
Cloneable roles
—
Above displacement threshold
Like
Illustrative provider-group P&L
A size-adjusted estimate of revenue, payroll, care-delivery labor COGS, and the annual value of capacity shifted to AI. Revenue and margin are scenario estimates—not forecasts for the named comparison organization. Released capacity must actually be converted into cost avoidance to create the modeled profit impact.
Estimated revenue
—
Workforce × revenue per employee
Loaded payroll
—
Wages plus selected employer load
Labor in COGS
—
Estimated care-delivery share
Labor value displaced
—
At current exposure and realization
AI annual run-rate
—
Released hours × AI cost/hour
Net P&L impact
—
Potential operating-profit uplift
Illustrative operating P&L bridge
Annual estimate
Estimated revenue
—
Baseline operating profit
—
Add: realizable labor value
—
Less: AI operating cost
—
Illustrative post-AI operating profit
—
Illustrative post-AI operating margin
—
Workforce COGS bridge
Annual estimate
Baseline labor in COGS
—
Less: realizable COGS labor value
—
Add: AI operating cost
—
Illustrative post-AI labor COGS
—
The $300,000 default revenue-per-employee assumption is a rounded provider-group scenario anchor; integrated payer-provider systems can run higher. The 3% baseline operating margin is editable. Wage anchors are rounded national BLS role benchmarks. AI cost excludes integration, change management, validation, and vendor minimums.
Where the workforce lives
Headcount by job family, scaled automatically to the selected workforce size. Evidence W1–W6 ↓
Where AI-addressable work lives
Point headcount × midpoint of the addressable task range.
Workforce assumptions Task-exposure levels
Low assumes narrow use and weak automation. Guarded is an early-deployment case. Base uses the central research estimate. High assumes broad use, strong integration, and favorable workflows.
Concentration slider
0% spreads the same average exposure evenly across everyone. 25–50% creates some specialization. 55–75% clusters much of the work. 80–100% puts nearly all affected work into specialist roles.
Healthcare example
Prior authorization may be concentrated among dedicated specialists, while documentation is spread across nearly every nurse. The same total hours imply very different cloneable-role counts.
Other-industry example
Invoice entry can sit with dedicated accounts-payable clerks, while email is spread across every office worker.
Task exposure controls the mean share of work affected. Concentration controls whether that exposure is spread across everyone or clustered into specialist roles. The model preserves the same mean exposure while changing the number of people above the displacement threshold.
Job family
Headcount
Task exposure
Concentration
Technical FTE-eq.
Augmented capacity
Cloneable roles
Primary-care day
Choose task-exposure levels below; the chart shows the resulting releasable share of a measured 480-minute day. Evidence T1–T9 ↓
Decision interpretation
The model now separates four concepts that should not be collapsed.
Technical exposure is the task-time that AI could affect.
Released capacity applies adoption and implementation realization.
Schedulable capacity discounts tiny, scattered time fragments that cannot become a usable appointment, shift, or work block.
Cloneable roles are the modeled people whose concentrated exposure clears the selected displacement threshold. This is a scenario—not a layoff forecast.
Concentration is the crucial bridge. Even exposure produces slack across many people; concentrated exposure creates a smaller number of potentially redesignable roles.
Why ten saved minutes rarely equals one fewer person
Time savings only become headcount when they are concentrated in the same roles, contiguous enough to schedule, and large enough that the residual work can be reassigned. Otherwise they become capacity, service, or slack.
1 · DistributionIs exposure spread across every worker, or concentrated in a specialist subset?
2 · ThresholdDoes an individual's affected share clear the point where the remaining work can be bundled elsewhere?
3 · ContiguityAre released minutes usable blocks—or two-minute fragments between irreducible tasks?
ATMs changed teller work before they removed teller jobs
ATMs automated routine cash handling, but lower branch operating costs encouraged more branches and tellers shifted toward relationship and sales work. James Bessen's analysis is a classic example of task automation expanding output and changing jobs rather than translating one-for-one into headcount.
Radiology productivity can be absorbed by volume and review
AI can shorten interpretation or drafting time while radiologists remain responsible for review and rising imaging demand absorbs capacity. In a Swedish mammography study, AI-supported screening reduced human workload by 44% while retaining radiologist oversight—large task savings without a simple 44% headcount conclusion.
Emergency clinicians: many minutes, many fragments
A time-motion study recorded 5,061 tasks in 58.7 hours; 44.7% of time was spent on clinical-information-system work. The workload was highly interrupted and fragmented, so removing clicks or seconds does not automatically create a schedulable block or eliminate the need for the clinician.
OECD research emphasizes the task content of individual jobs rather than occupation averages. Two people with the same title can have very different exposure—exactly the distinction controlled by the concentration slider.
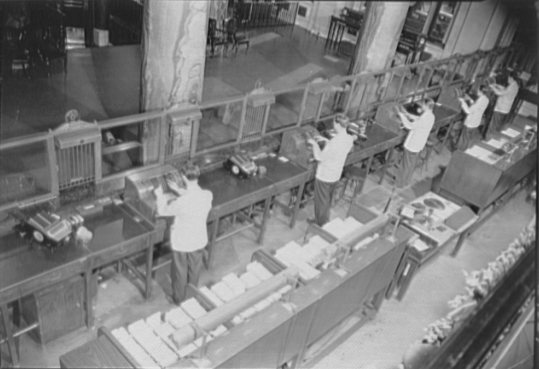
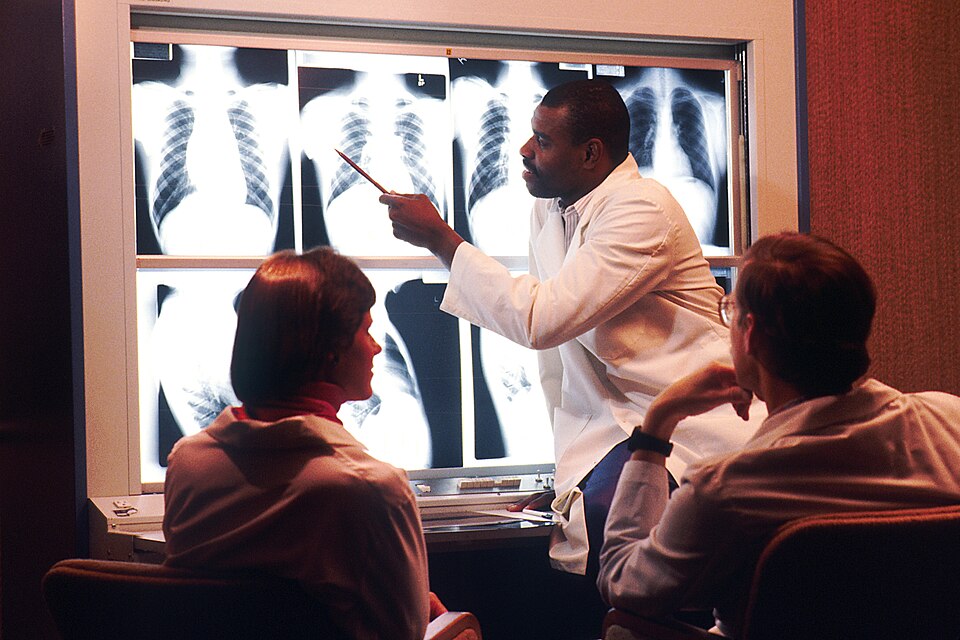
Image credits: Library of Congress / Gottscho-Schleisner collection and National Cancer Institute / Bill Branson. Both are identified by their repositories as public domain in the United States.
Leverage landscape for the primary-care day
Large technology, services, outsourcing, and virtual-care companies that can reduce work or offer an alternative delivery path—plus relevant companies from the LifeX portfolio. Select any company to visit its site.
LifeX portfolio marks companies backed by LifeX.Examples are directional, not endorsements or a claim of equivalent capabilities.
Physician task assumptions
One click selects a bundled low, guarded, base, or high estimate for each activity.
Activity
Minutes/day
Task exposure
Gross releasable
Automation / augmentation
Research evidence and provenance
The model triangulates organizational disclosures, federal occupational data, clinician time studies, workflow research and task-level AI frameworks. No single source contains the complete answer. Each source below states what it supports—and what it does not.
Observed anchor Public organization scale or federal occupational counts used directly.
Measured workflow Time-and-motion, direct observation or validated EHR event-log evidence.
AI calibration Task frameworks used to bound technical exposure, not predict layoffs.
Governance Safety, accountability and adoption constraints applied to interpretation.
Workforce scale and composition
W1 · Northwell workforce scale
Observed anchorSupports the 100,000+ denominator and integrated-provider footprint: 28 hospitals and 1,000+ outpatient facilities. It does not disclose a complete job-family census.
Boundary checkReports a 20,000+ physician network. We do not treat this as 20,000 employed physicians; the model distinguishes network affiliation from employee headcount.
Observed anchorBLS industry staffing counts by occupation underpin the relative scale of nurses, physicians, support, laboratory, pharmacy, facilities and administrative work in hospitals.
ContextSupports the constraint that released capacity will coexist with rising demand: healthcare support and practitioner occupations are among the fastest-growing groups.
The slider displays the closest reported employee count—not a claim that the organizations have the same workforce mix, operating model, or scope. Counts are rounded and reflect each system's own terminology and reporting period.
NYC practice markerThe Midtown-founded specialty group reports 120+ locations and 400+ providers; its company profile places employment in the 1,001–5,000 range.
National scale markerA named national healthcare enterprise replaces the former generic largest-scale placeholder. Its mixed payer, care-delivery, pharmacy, and technology model is not directly comparable to a provider-only group.
Clinician time, workflow and administrative burden
T1 · Sinsky et al., physician time-and-motion
Measured workflowDirect observation across ambulatory practices found substantial desk/EHR work and established the widely cited relationship between face time and EHR/desk work.
Measured workflowEvent logs for 142 family physicians, validated with observation: 355 EHR minutes per weekday, including documentation/order/coding and inbox work. Central calibration for the PCP day.
Measured workflowObserved 20 physicians in five clinics before and after EHR implementation; informs visit-level time allocation and cautions against assuming digitization automatically reduces total time.
MethodDevelops a shared physician/nurse time-motion taxonomy for direct care, documentation and other work. Supports consistent task categories across clinical roles.
Measured workflowStudied 767 nurses across 36 medical-surgical units; identifies documentation, medication administration and care coordination as major nursing-time pools.
Intervention evidencePre/post time-motion study found a mobile workflow reduced EHR documentation by 4.1 minutes per observed hour, illustrating plausible task-level—not job-level—capacity release.
Administrative burdenCMS cites estimates of roughly 13 hours per week and 700 hours annually per provider associated with prior authorization, supporting a high addressable range for forms and revenue-cycle workflows.
AI calibrationFrames expected change as task shifting and augmentation more than full job automation, and highlights trust, skills, validation and implementation constraints.
A2 · OECD digital and AI skills in health occupations
AI calibrationAnalyzes 55.5 million job postings and classifies health occupations by augmentation/automation susceptibility. Supports higher augmentation than automation ratings for clinicians.
Task ontologyProvides occupation-specific task statements, ratings and work activities. It supports decomposing jobs into activities rather than assigning one automation score to an entire occupation.
External benchmarkHealthcare analysis estimates 35% technical automation potential but a lower midpoint adoption outcome, reinforcing the model's separation of technical potential from realization.
External benchmarkMGI-style activity analysis finds healthcare automation potential around the mid-30% range and emphasizes that many occupations are transformed at the task level rather than eliminated.
Evidence synthesisCatalogues measures and interventions for documentation burden and illustrates variation by specialty, setting, data source and metric definition.
Cost loadBLS reports wages at approximately 70% of private-industry employer compensation, implying a roughly 43% load on wages for benefits and payroll costs.
Revenue anchorUPMC reports $34 billion of 2025 operating revenue and 100,000 employees, implying about $340,000 per employee for its integrated provider and insurance system. The model uses a lower, rounded $300,000 default and makes it adjustable.
How the evidence becomes a model. Workforce point estimates are a reconciled bridge—not a reported Northwell census. Addressable low/high percentages are analyst judgments informed by task content, measured workflow and external automation frameworks. The realization slider explicitly accounts for adoption and workflow friction. The editable design lets users replace every judgment with local HRIS, activity-log or pilot evidence.